From countless businesses to industry leaders, Experion uses Power BI to turn data into a competitive edge, making every insight a game-changer. In recent years, Business Intelligence (BI) has gained significant traction across industries. Today, the focus has shifted from merely collecting data to extracting actionable insights from it. In response, various solutions have surfaced, with Microsoft Power BI emerging as a standout choice for its robust decision-making capabilities. This blog will tell you there is a better way than just swimming in data- you can dive deep and find treasure that can supercharge your business.
What is Power BI?
 Power BI, Microsoft’s business analytics service, offers interactive visualizations and intelligence tools. It’s a comprehensive platform integrating software services, apps, and connectors. Users can create detailed reports and dashboards, extracting insights from various data sources and sharing them across their organization. Imagine a vast library overflowing with books in multiple languages and disciplines. BI acts as the librarian, meticulously organizing and cataloging this information. It encompasses a comprehensive set of tools, processes, and methodologies for gathering, storing, analyzing, and interpreting data. BI delves deeper than simply presenting raw numbers; it identifies patterns, trends, and relationships hidden within the data. Power BI integration involves connecting and incorporating data from various sources and systems into Microsoft Power BI.
However, it is crucial to present these insights in a way that resonates with a diverse audience. This is where data visualization becomes significant. Data visualization transforms complex numerical data into visually compelling or appealing narratives. It can be described as a user-friendly interface that allows both technical and non-technical users to access, analyze, and interpret data. Charts, graphs, maps, illustrations, and other visual elements become the language through which data is communicated. Effective data visualization simplifies the understanding of intricate datasets, allowing individuals to grasp key trends and connections at a glance. Simply put, it is the difference between deciphering a dense paragraph and appreciating an interesting infographic. This is the essence of Power BI. Power BI goes beyond traditional BI by offering an accessible platform. Let’s see how!
Power BI : Data analysis and visualization
 Power BI helps beyond preparing static reports. Its interactive visualizations empower users to delve deeper into the data, slice and dice it based on specific needs, and find nuanced insights that might escape traditional reports. This allows for a more dynamic and engaging exploration of data.
Imagine a culture where employees at all levels base their decisions on real-time, data-backed insights. Power BI fosters this environment by making data readily available and easily understandable in a visual format. This empowers informed decision-making across departments, leading to more strategic and successful outcomes.
Time is a precious commodity in business. Power BI streamlines the data analysis process by automating time-consuming tasks like data cleaning, transformation, and report generation. This enables employees to allocate their resources towards more advanced analysis and strategic endeavors.
Power BI is a strategic investment that unlocks the true potential of your data.
Key Features of Power BI
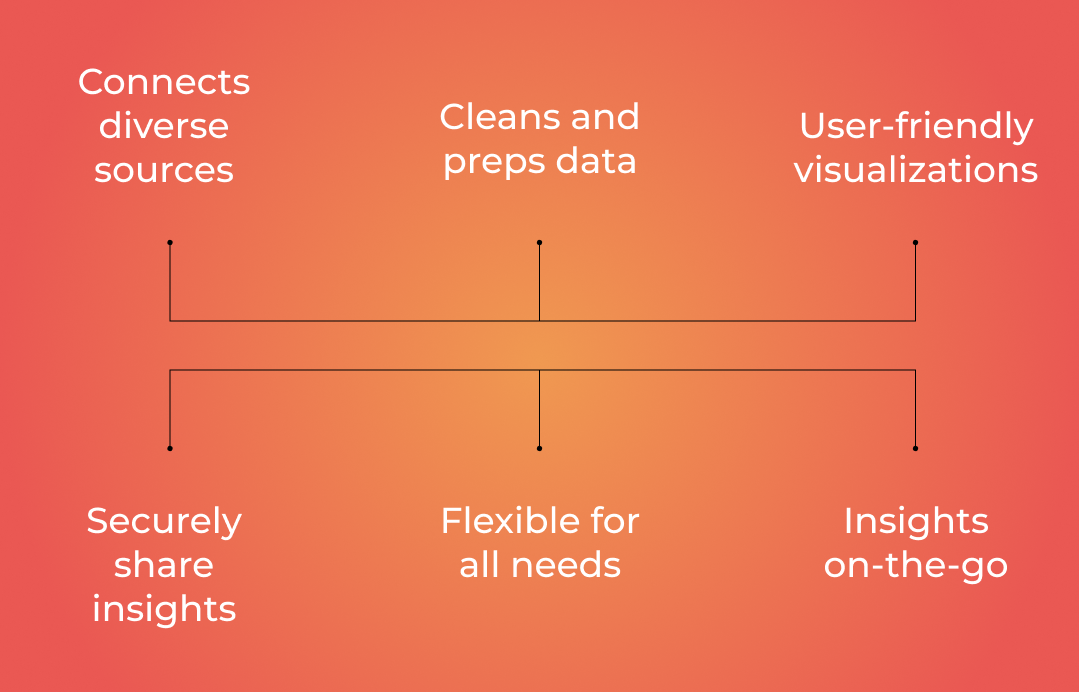
Seamless Data Connectivity and Transformation:
Connectivity: Power BI seamlessly integrates with various data sources, including internal databases, spreadsheets, cloud-based apps, and social media platforms.
Consolidation: It facilitates the consolidation of data from disparate sources, offering a unified view of organizational operations.
Transformation: Robust data transformation tools ensure the accuracy and reliability of insights by addressing inconsistencies and errors.
Intuitive Visualization and Tailored Reporting:
User-Friendly Interface: Power BI offers an intuitive interface, allowing users to create visually appealing reports and dashboards effortlessly.
Drag-and-Drop Functionality: Users can leverage drag-and-drop functionality to create interactive visualizations like charts, graphs, and maps.
Flexibility: Whether utilizing pre-built templates or customizing dashboards, Power BI caters to users of all proficiency levels.
Collaboration, Accessibility, and Mobility:
Secure Sharing: Power BI fosters cooperation by enabling secure sharing of insights within teams and departments.
Consistent Access: Stakeholders have consistent access to data and insights, fostering alignment and informed decision-making.
Mobile Compatibility: Power BI is compatible across devices, including smartphones and tablets, empowering users with on-the-go access to critical data.
Efficiency Through Automation and Integration:
Automated Reporting: Streamlined workflows are achieved through automated report generation, ensuring consistency in data presentation.
Security Measures: Robust security measures and governance protocols safeguard sensitive information, maintaining compliance with regulatory standards.
Integration: Seamless integration with other Microsoft products fosters a unified data analysis ecosystem, maximizing synergy between existing tools.
Embracing Power BI signifies a commitment to leveraging data as a strategic asset, propelling organizations toward excellence and innovation in an ever-evolving business landscape.
Why Integrate Power BI?
By integrating Power BI into their operations, organizations can unlock a door of possibilities. Here’s why integrating Power BI into your business operations is a strategic move:
Improved Data Insights and Decision-Making
From Drowning in Data to Discovering Insights: Organizations are bombarded with information, but extracting actionable insights remains a challenge. Power BI bridges this gap. By integrating data from various sources, Power BI creates a holistic view. Its interactive visualizations allow users to explore data from different angles, uncovering hidden patterns and trends. This empowers data-driven decision-making at all levels, leading to more informed and strategic choices.
Streamlined Data Collection and Management
Fragmented data scattered across spreadsheets and departments creates a data management nightmare. Power BI acts as a central hub, seamlessly connecting to diverse data sources. It streamlines data collection, cleaning, and transformation, eliminating manual tasks and ensuring data accuracy. This saves valuable time and resources, allowing your team to focus on analysis and insights.
Enhanced Collaboration and Data Sharing
Traditionally, data insights often reside in siloed reports, hindering collaboration. Power BI promotes a culture of knowledge sharing. Its interactive dashboards and reports can be shared securely within the organization. This facilitates communication across departments, ensures everyone is on the same page with the latest data, and empowers collaborative decision-making.
Cost-Effective and Scalable Solution
Power BI offers a big return on investment. Its subscription-based model scales with your needs, making it accessible to businesses of all sizes. Additionally, by automating data analysis tasks and improving decision-making, Power BI can generate significant cost savings in the long run.
Power BI: Integration with Various Data Sources
Power BI’s strength lies in its ability to connect to both internal and external. This allows you to create a unified view of your business, regardless of where your data resides. Here’s how Power BI seamlessly integrates with various data sources:
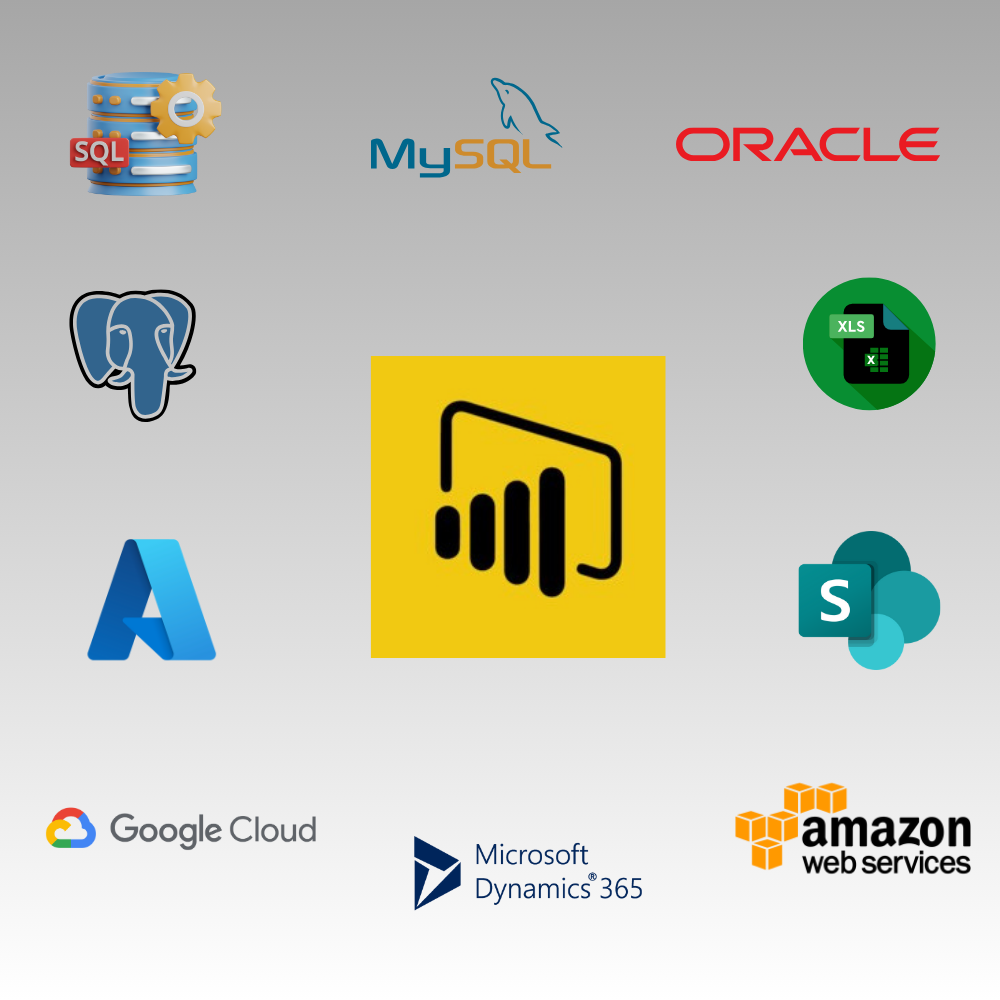
Connecting Power BI to Databases
Relational Databases: Power BI connects effortlessly with popular relational databases like SQL Server, MySQL, Oracle, and PostgreSQL. This allows you to directly access and analyze structured data residing in your on-premises databases.
Integrating with Cloud Platforms
Cloud Powerhouses: Power BI integrates seamlessly with major cloud platforms like Microsoft Azure, Google Cloud Platform (GCP), and Amazon Web Services (AWS). This empowers you to leverage data stored in cloud-based data warehouses and data lakes, fostering a truly hybrid data analysis environment.
Connecting to Online Services
Familiar Tools, Enhanced Analysis: Power BI bridges the gap between your existing workflows and data analysis. It connects effortlessly with popular online services like Excel, SharePoint, and Dynamics 365. This allows you to directly analyze data stored in these platforms, enriching your existing business processes with data-driven insights.
Importing Data from APIs and Custom Sources
Beyond the Ordinary: Power BI caters to the need for data diversity. It offers the flexibility to import data from various APIs (Application Programming Interfaces) and even custom data sources. This allows you to integrate data from social media platforms, marketing automation tools, and other specialized applications, creating a truly comprehensive data landscape within Power BI.
By leveraging Power BI’s extensive data connectivity options, you can break down data silos and create a unified view of your organization. This empowers you to make informed decisions based on a complete picture of your business operations.
Power BI Integration Strategies
Embedding Power BI Reports in Applications and Websites
 Insights at Your Fingertips: Power BI reports can be seamlessly embedded within your existing applications and websites. This allows users to access critical data insights directly within their workflow, improving decision-making efficiency and eliminating the need to switch between different platforms.
Imagine critical data insights readily available within the applications and websites your employees and customers use most.
Power BI empowers this by allowing you to embed reports directly into these platforms seamlessly. This reduces the need for users to switch between different platforms to access data, improving efficiency and empowering informed decision-making right within their workflow.
Automating Data Refresh and Updates
Always Fresh Data, Always Informed Decisions: Keeping your data up-to-date is crucial for accurate insights. Power BI allows you to automate data refresh and updates. This ensures your reports and dashboards always reflect the latest information, empowering data-driven decision making in real-time.
Implementing Role-Based Access Control and Security
Data Security Made Easy: Data security is paramount. Power BI offers robust role-based access control (RBAC) functionalities. You can define specific data access permissions for different user groups, ensuring sensitive information remains secure while relevant data is readily available to authorized personnel.
Customizing Power BI Visuals and Dashboards
Tailored Insights, Enhanced Communication: Power BI empowers customization. You have the capability to design visually captivating reports and dashboards that cater to the unique requirements and goals of different stakeholders. This allows you to present data in a way that resonates with different user groups, fostering better communication and understanding of key data points.
By implementing these integration strategies, you can leverage Power BI’s full potential. You are capable of creating a centralized hub for data insights, which facilitates informed decision-making across all organizational levels and fosters a collaborative ethos rooted in data-driven practices.
Power BI offers exceptional value beyond just data access. It provides a robust set of integration strategies that seamlessly embed data insights within your existing workflows, fostering a data-driven culture across your organization. Here’s a breakdown of some essential strategies:
Power BI Integration: Best Practices
Trusted by a wide range of businesses, Experion’s Power BI solutions turn data into actionable insights, fostering reliable growth and efficiency. Integrating Power BI offers a powerful way to unlock the value of your data. However, to maximize its effectiveness, following best practices is crucial. Here’s an overview of the key areas to concentrate on:

Ensuring Data Quality and Consistency
The reliability of your insights is directly influenced by the quality of your data. Implement data quality checks to identify and address errors, inconsistencies, and missing values in your data sources. Maintain data governance policies to ensure data accuracy and consistency across your organization.
Maintaining Data Security and Privacy
Data security is paramount. Leverage Power BI’s role-based access control (RBAC) to define data access permissions for different user groups. Implement robust security measures to safeguard sensitive data and comply with relevant data privacy regulations.
Optimizing Performance and Efficiency
Power BI offers various ways to optimize performance. Utilize data modeling techniques to structure your data efficiently. Consider implementing incremental refreshes for large datasets to ensure timely updates without sacrificing performance.
Keeping Reports and Dashboards User-Friendly and Intuitive
Design reports and dashboards with user needs in mind. Prioritize clear visuals, concise labels, and intuitive navigation. Avoid overwhelming users with information overload. Focus on presenting actionable insights in a way that is easy to understand and interpret.
Continuously Monitoring and Iterating on Integration Solutions
Data analysis needs to evolve over time. Regularly monitor the effectiveness of your Power BI integration. Collect user feedback, pinpoint areas for enhancement, and iterate on your reports and dashboards to guarantee they remain aligned with the evolving needs of your organization.
By following these best practices, you can lay a solid foundation for a successful Power BI integration. This ensures you’re leveraging data effectively, fostering informed decision-making, and empowering a data-driven culture within your organization.
Power BI Integration Challenges & Solutions
Despite being a potent business intelligence tool, Power BI presents certain challenges that users may encounter. Here’s an overview of these common hurdles and strategies to overcome them:
| Power BI Challenges | Solutions |
| Data Integration Challenge | Issue: Combining data from diverse sources (spreadsheets, databases) poses complexity. |
| Solution: Leverage Power Query’s data transformation tools. Consider establishing a central data warehouse for streamlined access. | |
| Data Quality Concerns | Issue: Presence of “dirty data” containing errors or inconsistencies, leading to unreliable insights.
|
| Solution: Implement data cleaning techniques within Power Query. Establish robust data governance standards. | |
| User Adoption Hurdles | Issue: Encouraging users to adopt Power BI dashboards and reports may face resistance.
|
| Solution: Ensure users receive comprehensive training and ongoing support. Develop intuitive reports with compelling visuals. | |
| Performance Challenges | Issue: Slow loading times and sluggish report interaction can impede user experience.
|
| Solution: Optimize data models. Utilize parameterization and consider hardware upgrades for improved processing speed. | |
| Data Governance Complexity | Issue: Managing self-service BI and ensuring data security presents challenges. |
| Solution: Establish robust data governance policies. Utilize Power BI’s built-in security features effectively. |
By addressing these common challenges proactively, organizations can maximize the effectiveness of Power BI as a powerful business intelligence tool, ensuring accurate insights and user satisfaction.
Power BI Advancements and Upcoming Features
 Power BI is constantly evolving, with Microsoft adding new features and functionalities to enhance data analysis capabilities. Here’s a glimpse into recent advancements and upcoming trends:
AI-Powered Insights: Artificial intelligence (AI) is poised to revolutionize data analytics. We can expect BI tools, including Power BI, to incorporate more advanced AI capabilities. This includes features like automated data analysis, anomaly detection, and predictive forecasting, leading to deeper and more actionable insights.
Natural Language Processing (NLP): Imagine interacting with your data using natural language. Advancements in NLP will empower users to ask questions and receive insights from their data in plain English, making data analysis more accessible and intuitive for everyone.
Focus on Augmented Analytics: The future of BI lies in augmented analytics. This refers to tools that use AI and machine learning to augment human decision-making rather than replace it. Power BI can be expected to integrate features that guide users through complex data sets, suggest correlations, and highlight potential areas for exploration.
Enhanced Data Integration: Expect Power BI to expand its data integration capabilities further. This could include seamless connections to new data sources and platforms, making it even easier to consolidate data from a wider range of sources.
Deeper Cloud Integration: The future is cloud-based. We anticipate Power BI will offer even tighter integration with major cloud platforms like Azure, fostering a seamless and scalable data analysis environment.
Citizen Data Scientist Tools: Citizen data scientists are non-technical users who leverage data analytics tools for insights. Power BI is likely to incorporate more user-friendly features and drag-and-drop functionalities, empowering citizen data scientists to contribute more effectively to data-driven decision-making.
The Future of Data Visualization and Decision-making
Interactive and Immersive Visualizations: Data visualization is becoming more interactive and immersive. Imagine exploring data through 3D visualizations or using virtual reality (VR) to interact with complex datasets. Power BI may incorporate such features, allowing for deeper engagement and a more intuitive understanding of data.
Real-Time Decision Making: The future of business thrives on real-time insights. Power BI can be expected to evolve to provide near real-time data analysis, empowering organizations to make data-driven decisions with minimal latency.
Democratization of Data Insights: The future of data analysis is accessible to everyone.Power BI’s advancements will likely focus on making data insights more readily available and understandable for users at all levels within an organization, fostering a truly data-driven culture.
Real-world Examples of Power BI in Action
To solidify your understanding of Power BI integration’s value, here are some real-world use cases from various industries. These showcase how organizations leverage Power BI to solve specific challenges and achieve remarkable results. These are just a few examples, but the possibilities are extensive:
 Retail: A retail giant uses Power BI to analyze customer purchase history, identify buying trends, and optimize product placement for increased sales. By visualizing data, they gain insights into popular products and seasonal variations. With this information, they optimize product placement in their stores, creating a better shopping experience and boosting sales.
Manufacturing: A manufacturing company utilizes Power BI to monitor production line efficiency, identify potential bottlenecks, and make data-driven decisions to improve operational performance. By analyzing data in real-time, they can make informed decisions to improve overall performance. This approach allows them to make adjustments as needed, ensuring smooth and efficient production processes.
Healthcare: In the healthcare sector, a provider turns to Power BI for valuable insights. They use it to track patient outcomes and analyze the effectiveness of treatments. By visualizing data, they can identify trends and patterns that help improve patient care. With Power BI’s analytics, they gain a deeper understanding of what works best for their patients, ultimately improving the quality of care they provide.
Conclusion
Organizations that leverage data effectively gain a significant competitive advantage. Power BI integration enables you to achieve precisely that objective. It transcends mere data accessibility by furnishing a holistic solution for data analysis, visualization, and collaboration. By adhering to the recommended practices and remaining abreast of emerging trends, you can ensure that your Power BI integration matures in tandem with the evolving requirements of your organization. This paves the way for a data-driven future where insights fuel success and empower you to make informed decisions with confidence.
Key Takeaways
Advantages: Real-time decision-making, automation, seamless connectivity
Key features: Intuitive visualization, collaboration tools
Integration benefits: Improved insights, cost-effectiveness
Strategies: Embedding reports, automating refresh, role-based access control
Best practices: Data quality assurance, security maintenance, performance optimization
Challenges: Data integration, user adoption
Future trends: AI insights, deeper cloud integration
Partner with Experion to elevate your business intelligence with Power BI! From interactive dashboards to actionable insights, we turn your data into a powerful growth engine. Let’s drive smarter decisions together!

